background knowledge
📈 Trendline Continuation Signals: How Traders Identify the Next Move in an Existing Trend
Trendlines are among the simplest tools in technical analysis — but when used correctly, they can provide powerful clues about whether an existing trend is likely to continue.
While many traders focus on breakouts 🚀, an equally important setup is the trendline continuation signal 🔄.
This occurs when price pulls back toward a trendline, finds support or resistance, and then resumes the prevailing trend.
The key question isn’t simply:
“Is price touching the trendline?”
It’s:
🎯 “Is price confirming that the trend remains intact?”
🔎 What Is a Trendline Continuation Signal?
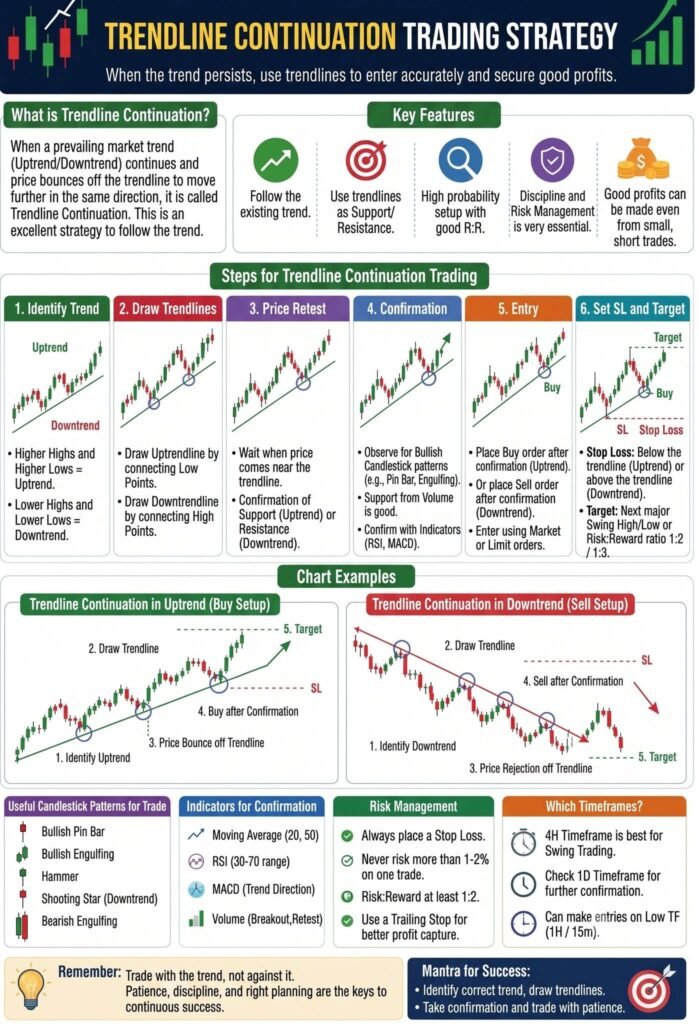
A trendline continuation signal occurs when an established trend experiences a temporary pullback and then resumes its original direction after interacting with a trendline.
🟢 Uptrend
An upward trendline connects a series of higher lows 📈.
When price pulls back toward the trendline and buyers step in, the trend may continue higher.
🔴 Downtrend
A downward trendline connects a series of lower highs 📉.
When price rallies toward the trendline and sellers return, the downtrend may resume.
💡 Why Trendline Continuations Matter
A continuation setup allows traders to participate in an existing trend rather than trying to predict a completely new one.
Instead of asking:
🔮 “Will this stock reverse?”
the trader is asking:
📊 “Is the existing trend still being defended?”
Potential advantages include:
- 🎯 Defined entry area
- 🛡️ Clearer invalidation level
- 📐 Potentially favorable risk/reward
- 📈 Alignment with the prevailing trend
- 🔍 Easier identification of support/resistance
- ⏱️ Opportunities during temporary pullbacks
🟢 Bullish Trendline Continuation
A bullish continuation develops inside an established uptrend.
Typical characteristics:
- 📈 Higher highs
- 📈 Higher lows
- 📐 Rising trendline
- 🔻 Temporary pullback
- 🛡️ Trendline support
- 🕯️ Bullish reversal candle
- 📊 Improving volume
- 🚀 Break above short-term resistance
A particularly interesting setup occurs when the trendline overlaps with another support area.
For example:
📐 Rising Trendline + 📊 20-Day Moving Average + 🔄 Previous Breakout Level
That combination creates a potential support confluence zone.
🔴 Bearish Trendline Continuation
The opposite structure develops during a downtrend.
Typical characteristics:
- 📉 Lower highs
- 📉 Lower lows
- 📐 Falling trendline
- 🔺 Temporary rally
- 🚧 Trendline resistance
- 🕯️ Bearish reversal candle
- 📊 Increasing selling volume
- 💥 Break below short-term support
Here, the trendline acts as dynamic resistance.
🕯️ The Most Important Confirmation: Price Reaction
A trendline touch alone is not a trading signal ⚠️.
Price can touch a trendline and continue straight through it.
That’s why confirmation is important.
🟢 Bullish confirmation signals
Look for:
- 🕯️ Bullish engulfing candle
- 🔨 Hammer/rejection candle
- 📈 Higher low
- 🚀 Break above previous candle high
- 📊 Increasing volume
- ↗️ RSI turning higher
- 🔄 MACD bullish crossover
- 💪 Momentum recovery
🔴 Bearish confirmation signals
Look for:
- 🕯️ Bearish engulfing candle
- ⭐ Shooting star/rejection candle
- 📉 Lower high
- 💥 Break below previous candle low
- 📊 Increasing selling volume
- ↘️ RSI weakening
- 🔄 MACD bearish crossover
- 🧨 Momentum deterioration
The more independent signals point in the same direction, the stronger the technical case can become.
📐 Trendline Quality Matters
Not every line drawn on a chart is a meaningful trendline.
⭐ Stronger trendlines typically have:
👆 Multiple meaningful touches
A trendline respected several times is generally more informative than one based on two arbitrary points.
🧲 Clean reactions
Price should visibly react around the trendline rather than repeatedly slicing through it.
🎯 Important swing points
Use meaningful highs and lows rather than insignificant price fluctuations.
📏 Reasonable slope
Extremely steep trendlines can become difficult to maintain over time.
📊 Volume Confirmation
Volume can provide an important secondary confirmation.
🟢 Bullish continuation
Ideally:
🔻 Lower volume during pullback → 🔺 Higher volume during rebound
This can suggest that selling pressure is declining while buyers are returning.
🔴 Bearish continuation
Ideally:
🔻 Lower volume during rally → 🔺 Higher volume during decline
This can suggest that buyers are losing control while sellers become more aggressive.
⚠️ Volume should be treated as confirmation, not as a standalone signal.
📊 Trendline + Moving Average
One of the more useful continuation setups occurs when a trendline and moving average converge.
For example:
📐 Trendline Support
➕
📊 20-Day Moving Average
➕
🔄 Previous Breakout Level
When multiple technical indicators point toward the same price zone, that area may attract greater attention from traders.
The same principle applies to:
📐 Trendline resistance
➕
📊 Moving-average resistance
➕
🔴 Previous breakdown level
🧱 Trendline + Horizontal Support/Resistance
Horizontal levels can make trendline setups even more interesting.
Imagine a stock that:
- 🚀 Breaks above resistance
- 📈 Establishes an uptrend
- 🔻 Pulls back
- 📐 Reaches its rising trendline
- 🧱 Retests the former resistance level
- 🟢 Finds buyers
- 🚀 Resumes higher
The old resistance has potentially become new support.
This creates a powerful combination:
📐 Trendline + 🧱 Breakout Retest + 📈 Market Structure
⚠️ The Trendline Break Is a Warning
Continuation traders must also understand what can invalidate the setup.
For a bullish trend:
📈 Price above trendline
➡️ 🔻 Trendline break
➡️ 📉 Lower high
➡️ 📉 Lower low
This can indicate that the bullish structure is deteriorating.
However, one intraday move through a trendline doesn’t necessarily mean the trend has ended.
🔍 Look for confirmation:
- 🕯️ Daily closing-price break
- 📊 Increased volume
- 📉 Follow-through selling
- 🚫 Failure to reclaim trendline
- 📉 Formation of a lower high
The same principle applies in reverse to bearish trends.
🪤 Watch for False Breaks
Trendlines are zones, not perfectly precise mathematical barriers.
Price can temporarily violate a trendline and then reclaim it.
This is why traders should focus on:
Break + Confirmation + Follow-through
rather than reacting to every intraday violation.
⏱️ Multi-Timeframe Confirmation
Looking at multiple timeframes can significantly improve trendline analysis.
For example:
📅 Weekly
🟢 Primary trend = Bullish
📊 Daily
📐 Rising trendline remains intact
⏱️ 4-Hour
🔻 Pullback reaches trendline
⚡ 1-Hour
🕯️ Bullish reversal develops
This creates a top-down confirmation structure.
The higher timeframe establishes the trend, while the lower timeframe can help identify a more precise entry.
🔄 Common Trendline Continuation Patterns
🟢 Trendline Bounce
Price touches the trendline and reverses.
📐 → 🟢 → 🚀
🔄 Trendline Retest
Price breaks a level, returns to the trendline/support area and then resumes the trend.
🚀 → 🔻 → 🛡️ → 🚀
📦 Trendline Compression
Price repeatedly approaches the trendline while the trading range becomes increasingly narrow.
📉 ↘️ 📐 ↗️ 📉
This can eventually lead to a volatility expansion.
🔻 Deep Trendline Pullback
Price experiences a larger correction toward structural support before the primary trend resumes.
📈 → 🔻🔻 → 🛡️ → 🚀
These setups can sometimes offer attractive risk/reward because the entry occurs closer to structural support.
⭐ What Makes a High-Quality Setup?
A stronger continuation signal often combines several factors.
1️⃣ Established Trend
📈 The stock has already demonstrated directional momentum.
2️⃣ Clean Trendline
📐 The line connects meaningful swing points.
3️⃣ Controlled Pullback
🔻 The retracement doesn’t destroy the underlying market structure.
4️⃣ Technical Confluence
🎯 Trendline aligns with other technical levels.
5️⃣ Confirmation Candle
🕯️ Buyers or sellers demonstrate renewed control.
6️⃣ Volume Confirmation
📊 Volume supports the directional move.
7️⃣ Favorable Risk/Reward
⚖️ The potential reward justifies the amount of capital at risk.
🚫 What Traders Should Avoid
Be cautious when:
- ⚠️ Trendline has only two weak touches
- 🔀 Price repeatedly crosses the line
- 📈 Trend is extremely extended
- 📉 Momentum is diverging
- 📊 Volume is deteriorating
- 🏦 Major resistance is immediately overhead
- 🌎 Broader market is moving strongly against the setup
- ⚖️ Risk/reward is unattractive
A beautiful-looking trendline does not guarantee continuation.
🧭 Trendline Continuation vs. Trend Reversal
This is one of the most important concepts.
A pullback doesn’t automatically mean a reversal.
🟢 Bullish continuation
Higher High → Higher Low → Higher High → Higher Low
📈 ↗️ 📈 ↗️
🔴 Potential bearish reversal
Higher High → Lower High → Lower Low
📈 → 📉 → 💥
Once market structure begins producing lower highs and lower lows, the trader should question whether the original bullish trend remains intact.
🧠 StockInsight™ Trendline Continuation Framework
A simple screening framework can help standardize the setup.
🟢 BULLISH CHECKLIST
☑️ 📈 Established uptrend
☑️ 📐 Rising trendline
☑️ 🔻 Pullback toward trendline
☑️ 🛡️ Support nearby
☑️ 📊 Momentum stabilizing
☑️ 🕯️ Bullish reversal signal
☑️ 📈 Volume improves
☑️ 🚀 Short-term breakout
☑️ ⚖️ Attractive risk/reward
☑️ 🛑 Clearly defined invalidation
🔴 BEARISH CHECKLIST
☑️ 📉 Established downtrend
☑️ 📐 Falling trendline
☑️ 🔺 Rally toward trendline
☑️ 🚧 Resistance nearby
☑️ 📊 Momentum weakening
☑️ 🕯️ Bearish reversal signal
☑️ 📉 Selling volume increases
☑️ 💥 Short-term breakdown
☑️ ⚖️ Attractive risk/reward
☑️ 🛑 Clearly defined invalidation
🎯 The Bottom Line
Trendline continuation signals are ultimately about identifying trend persistence.
The trendline provides the structure 📐.
The pullback provides the opportunity 🔻.
Confluence provides additional evidence 🎯.
Price action provides confirmation 🕯️.
Volume provides supporting evidence 📊.
And risk management determines whether the trade makes sense 🛡️.
🚀 StockInsight™ Key Principle
📈 Respect the trend. 🔻 Wait for the pullback. 📐 Watch the trendline. 🕯️ Wait for confirmation. 🎯 Define the risk. 🚀 Let price prove the continuation.
#TechnicalAnalysis #Trendlines #StockTrading #TechnicalTrading #TradingSignals #PriceAction #StockMarket #TradingStrategies #MomentumTrading #StockInsight