What Do We Offer
Insider Trades.
Insider Trades are purchases (or sales) of shares by important people like CEO, CFO of a company. Significant purchases can be a buy signal because of their inside knowledge of a company.
We focus on buys only that give you a potential entry point for a stock with considerable upside potential.
Our Insider Buy List is manually and carefully curated. Not every buy is relevant for trading (actually most are not). We sift daily through the data and give you the ones that count!

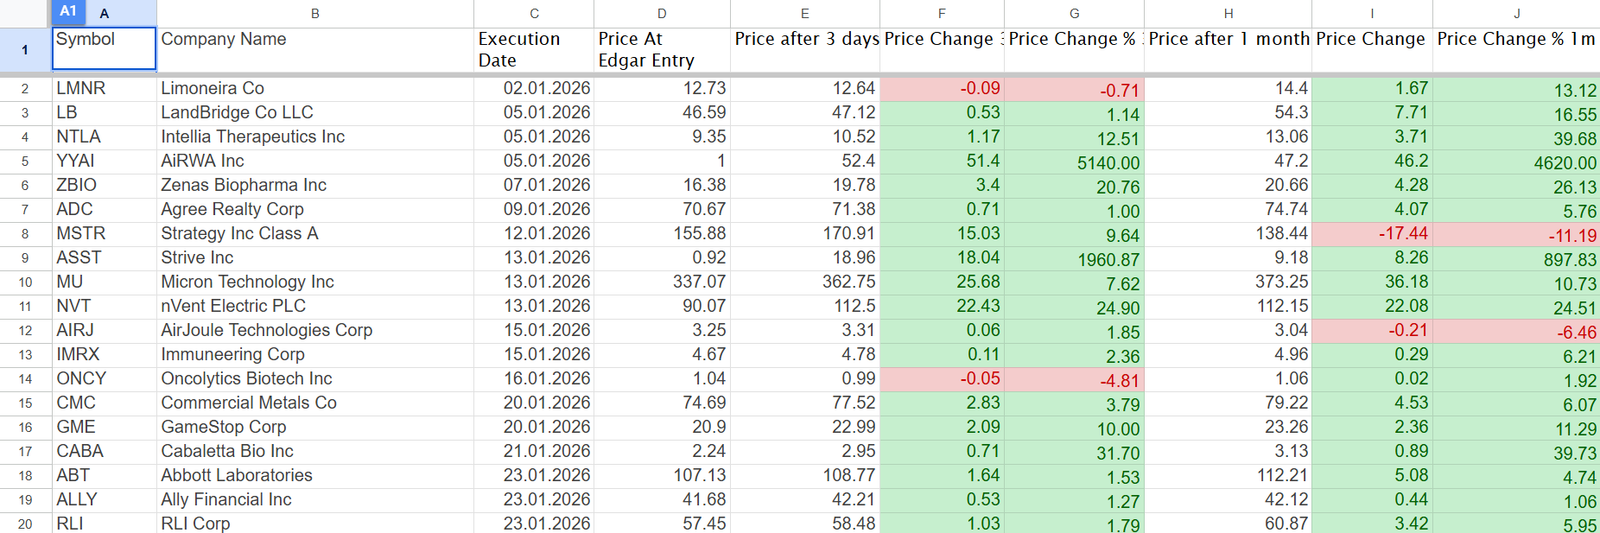
See some breathtaking insider trades
on 11th Dec 2024

Price movement 3 days
+55 %
on 10th Dec 2024

Price movement 3 days
+ 32 %
on 21st Nov 2024

+ 189 %
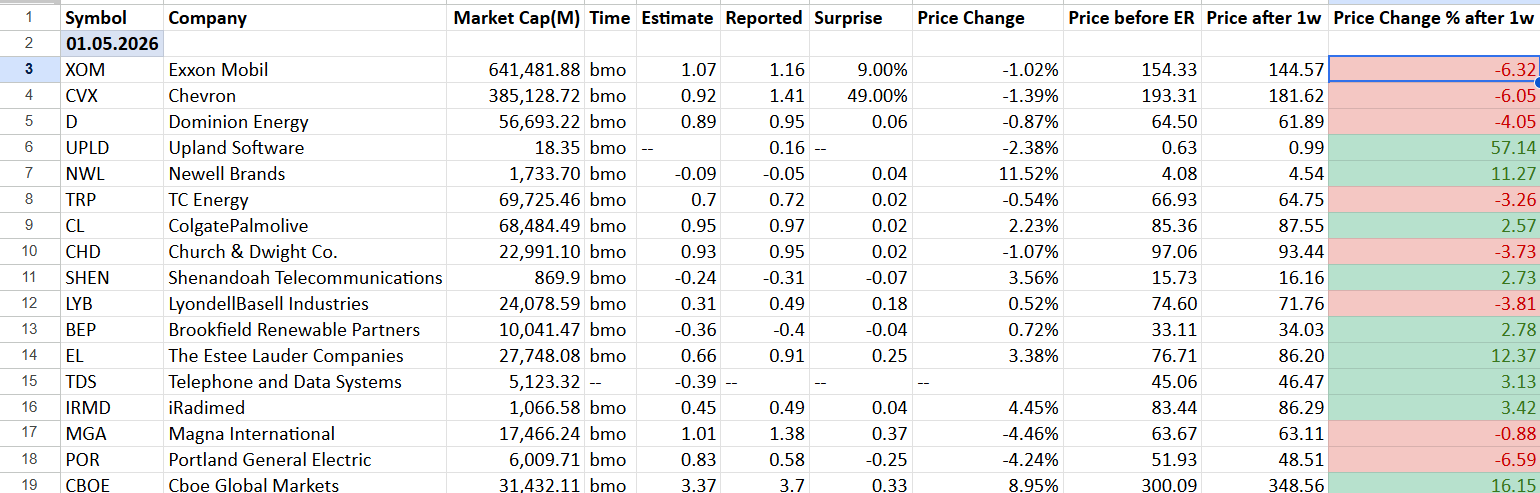
Earnings Summary Reports.
Earnings represent an important quarterly event for every publicly traded company. Mostly, not the past quarter, but the outlook / guidance is watched closely. Those numbers can lead to significant price action in the days after the Earnings Release.
We focus important data points like Earnings, Sales and Guidance.
You not only see the price right after the ER, but also after 1 week to get a better picture.
Most stocks react the same every quarter if you know the numbers. With this list, you can easily see the “loved” and “hated” stocks on Wall Street.

Biotech Catalysts.
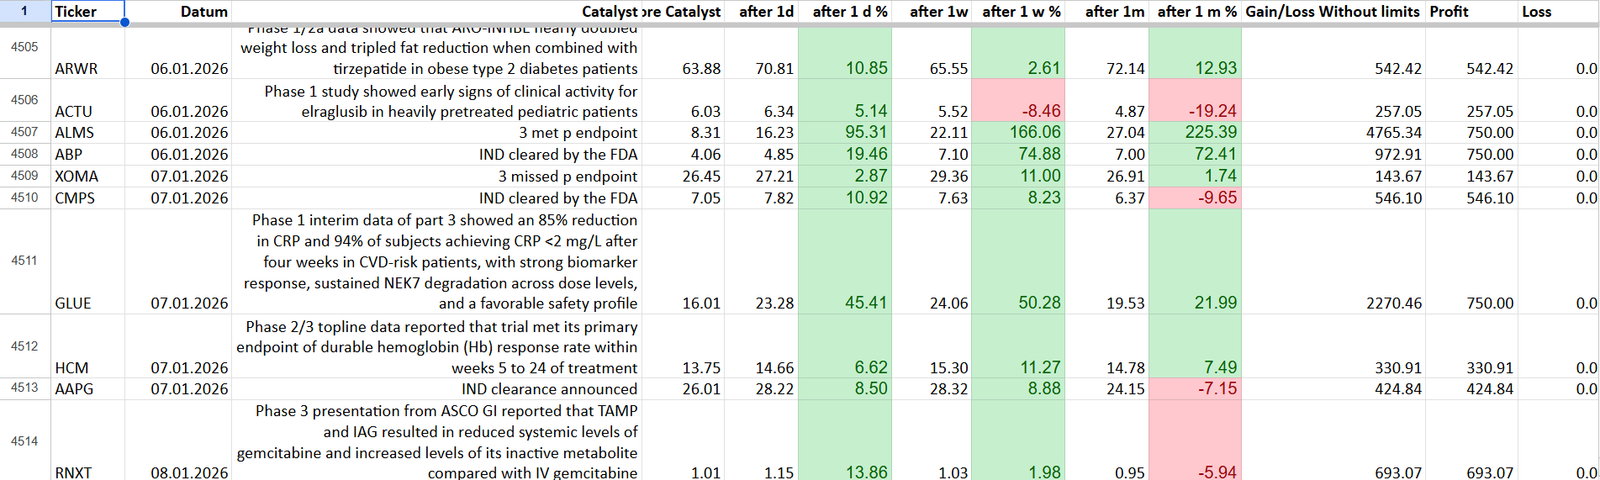
Our Biotech Stock Catalysts sheet contains small to medium-size biotech companies (up to around $5 billion marketc cap). When biotechs release trial data or get FDA approvals, they can soar rapidly and the price can multiple within hours. Get our daily updated list that dates back to 2018.
Biotech stocks are the ones with the highest upside potential in a very short time. A successful drug trial can lead to vast market potential. Just think about drugs for obesity, cancer or vaccines.
You see all the catalysts, price movements (1 day, 1 week and 1 month) and can edit the spreadsheet to suit your needs. You see sample calculations of potential benefits and much more…
Note: Biotech stocks have an enormous potential for price gains. The public float (that means the shares available) is limited. But don’t forget, where’s there gains, there are also losses. Drug trial failures (for example no superiority vs placebo) can lead to losses, too!

Catalysts Covered So Far
(and counting)
See some biotech catalysts of late 2024.
Stock price movement 1 day
+41 %

Stock price movement 1 day
+ 96 %

Stock price movement 1 day
+ 26 %
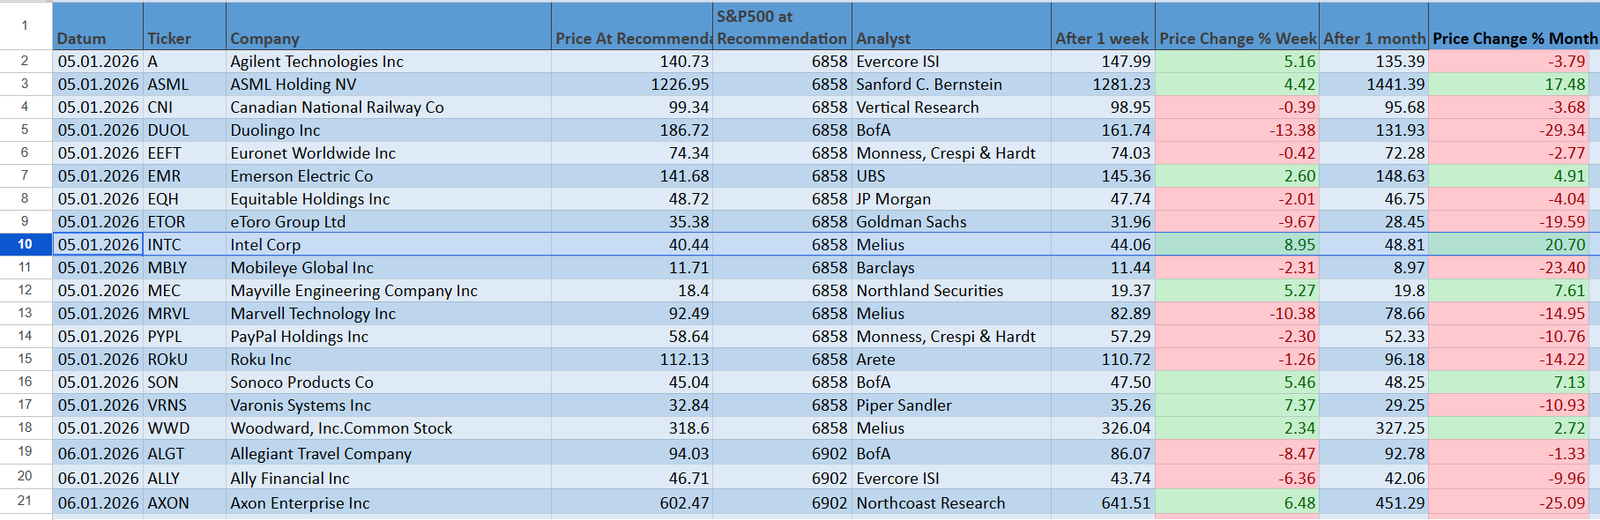
Analyst ratings.
Analysts from well-known banks, financial institutions and rating agencies can have a substantial impact on a stock short-term. Upgrades or downgrades mean that their respective customers are advised to buy or sell that stock.
Analyst ratings have a short-term impact that eases after a few days.
Nonetheless, they can depress or support a stock.
Take advantage with our daily updated list.
Dating back to 2018!
dating back to 2018!
Not only give the ratings a particular meaning of an individual analyst, but most of them have inside knowledge and are very diligent in their work.
So actually, you get important hints and background knowledge from them.

IPO.
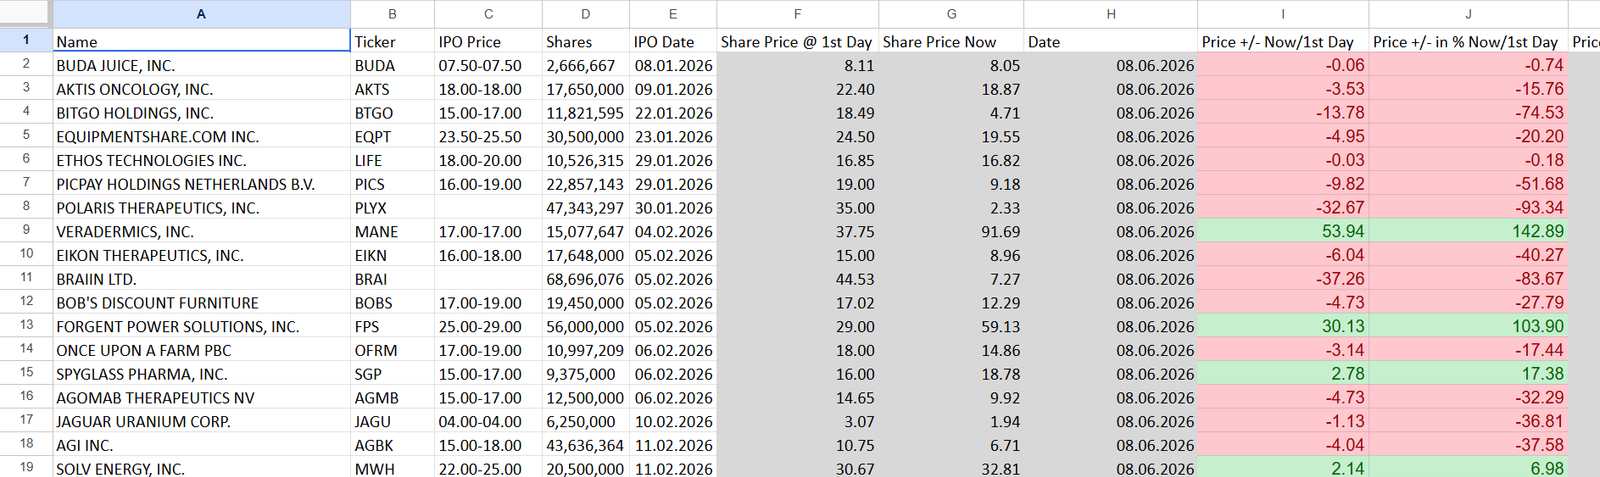
IPO means Initial Public Offering. It means a previously private company gets publicly listed and traded on an stock exchange. Some are small, but some are major enterprises that raise vast amounts of capital through the IPO. Especially in the first trading weeks, IPO’ed companies can go through the roof because of a great business model and a limited number of shares.
This report is updated weekly in advance and is completely free. It contains the necessary information for the newly listed company.
Note: IPO companies can have jittery price movements after the IPO date, especially around lockup and quiet period expiration (see above). Please take that into consideration!

Stock Buybacks.
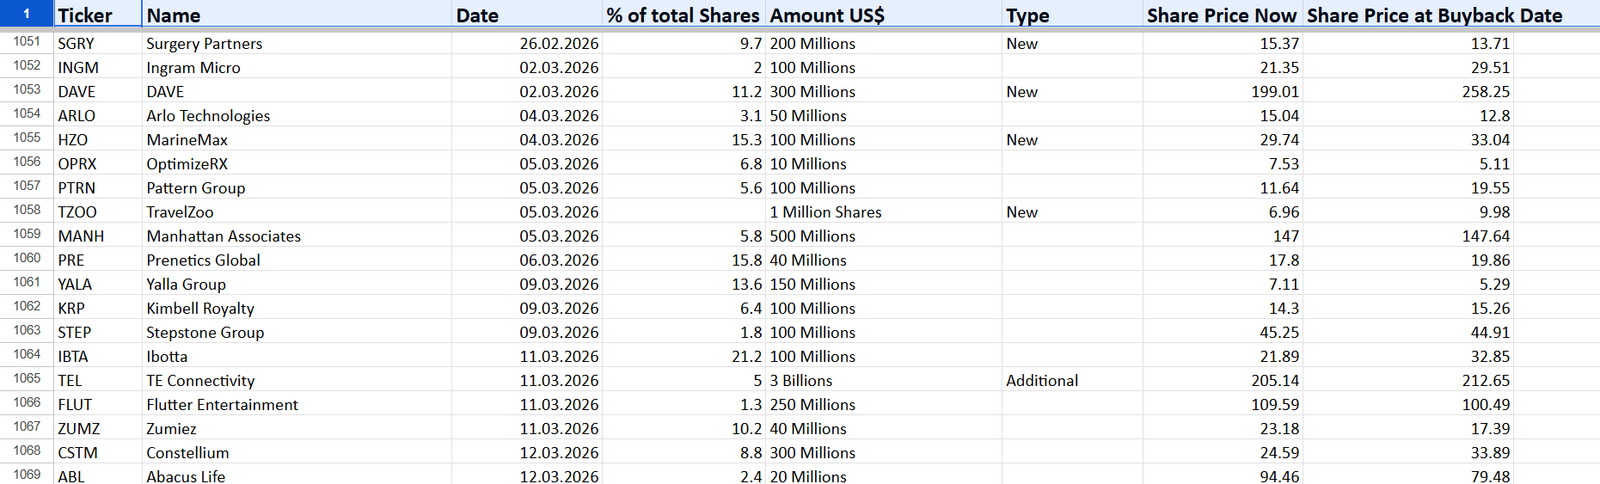
If companies are in excess of cash, they mostly opt for a stock buyback to decrease the publicly traded shares. This can lead to better EPS ratios (Earnings per Share). Stock buybacks often support the stock price because they get purchased by the company if the price falls too much (and the company saves money as bonus).
This report is updated weekly and is completely free. It contains all the necessary information like buyback amount and other relevant details.
dating back to 2018!
If an enterprise has the financial means of a stock repurchase, you get the confirmation that the company is financially solid and can afford such measures. This could be an investment trigger for you!

Stock Coverage.
Discover What Wall Street May Be Missing
Looking for professional-grade stock research without spending hours digging through earnings reports, analyst notes, and financial statements?
StockInsight™ Stock Initiation Reports provide a comprehensive deep dive into individual stocks, helping investors understand the opportunities, risks, and potential upside before making investment decisions. Depending on your plan, you’ll get a basic coverage (Free), extended coverage (Premium) or institutional grade report (Ultimate)
✅ Investment Rating & Price Target
✅ Detailed Business Overview
✅ Bull & Bear Investment Cases
✅ Financial Analysis & Forecasts
✅ Positive & Negative Catalysts
✅ Valuation Assessment
✅ Technical Analysis & Key Levels
✅ Risk Factors & Market Sentiment
✅ Clear Bottom-Line Investment Conclusion
dating back to 2018!
Whether you’re researching your next investment or looking for an independent second opinion, our reports deliver institutional-style analysis in an easy-to-understand format.
Suitable for long-term investors, dividend investors, short-term traders or everyone seeking fundamental insights into promising stocks and companies!


Market Radar Index (MRI)
Stay Ahead of the Market. Not Behind It.
The StockInsight™ Market Radar Index is our proprietary market intelligence tool designed to identify where momentum, capital flows, and investor attention are moving before the broader market catches on.
Built from a combination of price action, volume trends, relative strength, sector rotation, options activity, and market sentiment indicators, the Market Radar Index delivers a real-time view of market leadership and emerging opportunities.
• Detect emerging trends before they become mainstream
• Identify sectors attracting institutional capital
• Spot strengthening and weakening market momentum
• Track risk-on and risk-off sentiment shifts
• Uncover high-conviction trading and investing opportunities
• Improve market timing and portfolio positioning
Updated bi-weekly, it monitors
✓ Momentum Leaders
✓ Sector Rotation
✓ Relative Strength Trends
✓ Volume & Flow Signals
✓ Market Breadth
✓ Risk Appetite Indicators
✓ Institutional Activity
✓ Sentiment & Positioning Metrics


Daily refreshed Trade Ideas.
We have a plethora of lists that are refreshed on a daily basis, like 52-Week Lows/Highs, Premarket Movers, Bullish Divergence, Volume Advancers, Overbought & Oversold Stocks, Mortgage Rates and News (Mortgage Briefing) and compile a list of ready-to-use Trade Ideas with promising technical indicator setups.
Trade Ideas give you confidence by showing you promising technical setups that could lead to price gaps and momentum trades.
See what’s moving stocks before the market opens!
Our lists give you at-a-glance insights into stocks that are in focus: be it high volumes, deep discounts, extraordinary bottom fishing ideas and much more right at your fingertips!